We hear you: you want your buses to arrive on time! At County Connection, we recognize the critical importance of on-time performance and providing a service you can count on, and we want that, too!
In 2023, we conducted a passenger survey, something we do every three years, with results that guide our decisions on any service changes and route planning. 10% of riders we spoke to said they would ride County Connection more if our service was more reliable. And a sizable portion of people we surveyed (19%) rated our current reliability as fair or poor. These findings were enlightening, though not entirely surprising.
We are committed to providing excellent service to our passengers, but face many challenges, including ever-increasing traffic congestion and a nationwide driver shortage. (There’s plenty of buses, but not enough people to drive them.) Driver shortages have impacted our ability to run all service lines effectively, however, we are actively recruiting new drivers to address this issue, too! (Psst…we’re hiring!)
In response to the survey, our Planning team has been looking into ways to improve service reliability and the overall passenger experience. Last fall, we started using new data-driven software intended to improve service by continually tracking real-time bus location, and schedule adherence. This technology allows us to compare the actual running time of our buses as they travel down their routes against our published timetables. We are putting ourselves to the test by asking: are we delivering on our promises? By identifying differences between what we’ve scheduled and how our buses run, we can make informed changes to improve service reliability.
What does improved on-time performance look like?
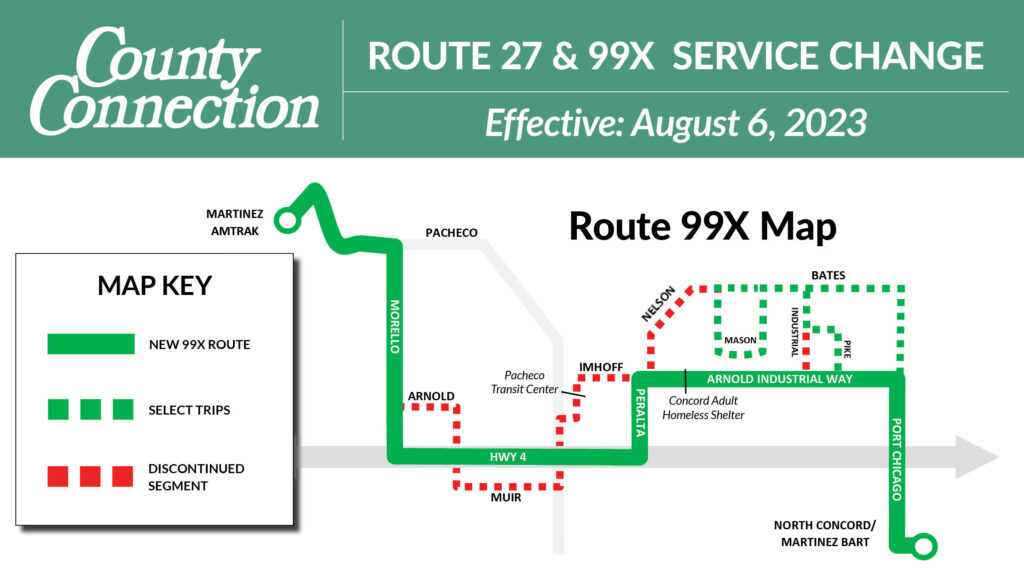
We recently made some changes to our schedules to make them more accurate and adjusted some routes to help our buses flow better with traffic or, when possible, avoid congestion altogether.
These changes were made to 24 routes, including weekday local, weekend, school, and express routes, and we’ve observed promising results (as shown in Table 1, below). Since these changes, 82% of our buses on these 24 routes are operating on-time. Across all 51 of our routes systemwide, 81% of our buses are on-time.
Table 1: On-time performance, measuring before Spring 2024 and after recent service changes (Current).
| SERVICE | Spring 2024 | Current | Change |
| Local | 78% | 82% | + 4% |
| Weekend | 74% | 82% | + 8% |
| Express | 76% | 82% | + 6% |
| School | 64% | 80% | + 16% |
| AVERAGE | 77% | 82% | + 5% |
In Table 1, the column Spring 2024, shows percentages when our buses were scheduled to arrive at timepoints and the percentage of time they were actually arriving on schedule. The column Current, shows how, after changes in service, on-time performance shifted and buses were arriving on schedule an average of +5% of the time. (For all you math brains out there, average on-time performance percentages are calculated based on the actual number of on-time arrivals across all routes where service changes were made, giving more weight to routes with a greater number of trips, rather than just averaging the percentages for each service type.)
Predictive tools at your fingertips
For passengers who want to stay informed about their bus’s arrival times, the Transit app and the route pages on our website include live feed maps showing the current location of the buses on your route, in addition to our published schedules (see below).

A new start in bus stop improvements
Additionally, we’re working to make system-wide improvements to our bus stops. As part of this initiative, we plan to install 28 new monitors that display real-time bus arrival times that are updated every 10 seconds. These displays will be housed in vandal-resistant cases and will include ADA-compliant text-to-speech features.
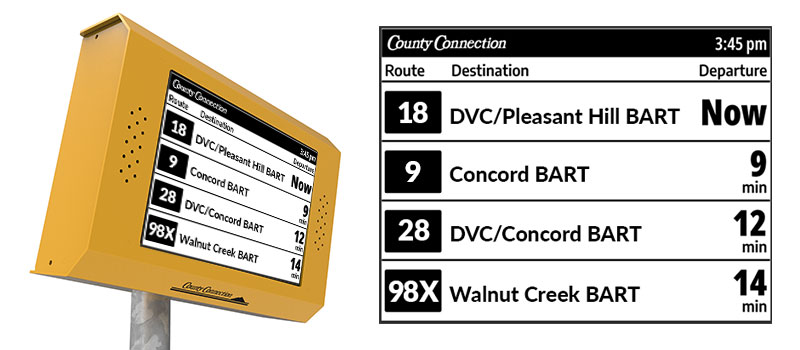
The short-term goal is to install a real-time bus arrival display at the busiest bus stop in each city within the County Connection service area, if the stop has at least 10 passenger boardings per day (excluding BART stations and transit centers, which will see new signage as part of the Metropolitan Transportation Commission’s Regional Mapping & Wayfinding Project coming in the next year). The remaining 18 displays will be installed at our other busiest stops, ensuring better coverage along various routes.
At County Connection, we are committed to continually enhancing our service and your experience. Thank you for your feedback, patience, and support as we make strides toward improving on-time performance and overall satisfaction.