WHY ARE THERE CHANGES IN SERVICE? County Connection is making time adjustments to some of our routes to better align with neighboring transit agency schedules and improve on time performance. The updated schedules are intended to provide a more seamless transit experience across agencies. If you have questions, contact Customer Service 925-676-7500.
¿POR QUÉ HAY CAMBIOS EN EL SERVICIO? County Connection está haciendo ajustes de tiempo en algunas de nuestras rutas para alinearse mejor con los horarios de las agencias de transporte vecinas y mejorar la puntualidad. Los horarios actualizados están destinados a proporcionar una experiencia de tránsito más fluida entre las agencias. Si tiene preguntas, comuníquese con Servicio al Cliente al 925-676-7500.
Do you have questions or thoughts on the service changes you’d like to share? Email planning@cccta.org and we’ll be glad provide a response or hear what you have to say.
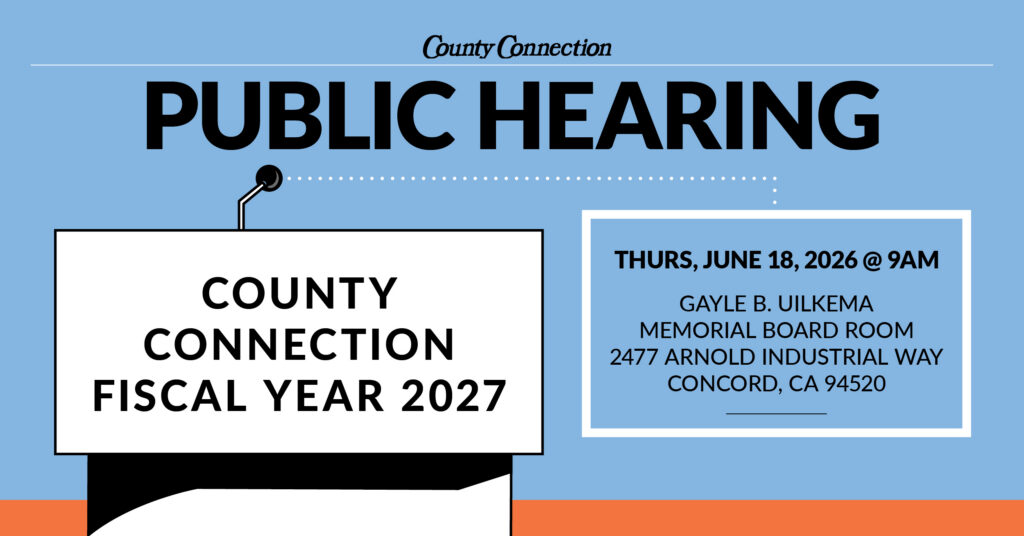
Notice of Public Hearing – Thursday, June 18, 2026, 9:00 am
Notice is hereby given that:
The Central Contra Costa Transit Authority’s (County Connection’s) proposed Fiscal Year 2027 budget is available for review at the County Connection offices, 2477 Arnold Industrial Way, Concord, California, or on the website, www.countyconnection.com in the Agenda section of the Report of Standing Committee – Administration and Finance Committee.
On Thursday, June 18, 2026, at 9:00 a.m., County Connection will hold a public hearing at the Board of Directors meeting on the social, environmental, and economic impacts as they relate to the FY 2027 budget at its offices, 2477 Arnold Industrial Way, Concord, California. A taxpayer may appear and be heard at that time and place regarding an increase, decrease, or omission of any item in the budget or inclusion of additional items. The hearing will also include the status of County Connection employee vacancies in accordance with Assembly Bill (AB) 2561. At the hearing, the Board will afford an opportunity for interested persons to be heard and instructions will be provided on the website or public comment may be submitted via email to hill@cccta.org.
Concord, CA – May 29, 2026 – County Connection supports the key findings and recommendations from the California State Auditor regarding East Bay Transit Agencies. County Connection itself, along with the five other transit agencies audited (AC Transit, Livermore-Amador Valley Transit Authority, Tri Delta Transit, and WestCAT), received no specific findings or recommendations.
“This audit reflects the hard work and dedication of our employees and leadership team,” said Bill Churchill, General Manager of County Connection. “We remain committed to managing public resources responsibly while continuing to provide safe, reliable, and efficient transit service to our community.”
The audit found that:
East Bay transit agencies regularly coordinate, both directly and through regional initiatives, and that there are few barriers to their collaboration;
An audit conducted while riding 25% of East Bay transit agencies’ bus routes that cross service areas found no significant obstacles for transit riders including transferring between agencies;
All East Bay transit agencies anticipate challenges in meeting the State’s requirements to purchase zero-emission vehicles because of their high cost and lack of direct funding;
Five of the six audited agencies may exhaust their reserves within the next one to five years and may need to reduce service without additional funding;
Merging or combining the agencies would not resolve the financial challenges of the agencies and would likely increase labor costs;
Board Chair Robert Storer said the positive findings reinforce public confidence in the agency’s operations and long-term planning efforts. “Our riders, employees, taxpayers, and funding partners deserve accountability and transparency,” Storer said. “These results demonstrate that the agency is meeting those expectations while positioning itself for a sustainable future.”
The audit recommended that:
MTC should establish realistic and attainable time frames for each of its transit action plan items by setting major milestones and subtasks for completion;
To address the risk that transit agencies may have to reduce services due to rising operation costs, MTC should, by January 2027, begin identifying additional funding sources that it could direct to transit agencies at risk of reducing services;
To ensure that agencies can comply with the California Air Resources Board’s (CARB) mandate to make all new bus purchases zero-emission starting in 2029, the Legislature should consider extending the deadline or allocating new funds to the transit agencies to purchase zero-emission vehicles.
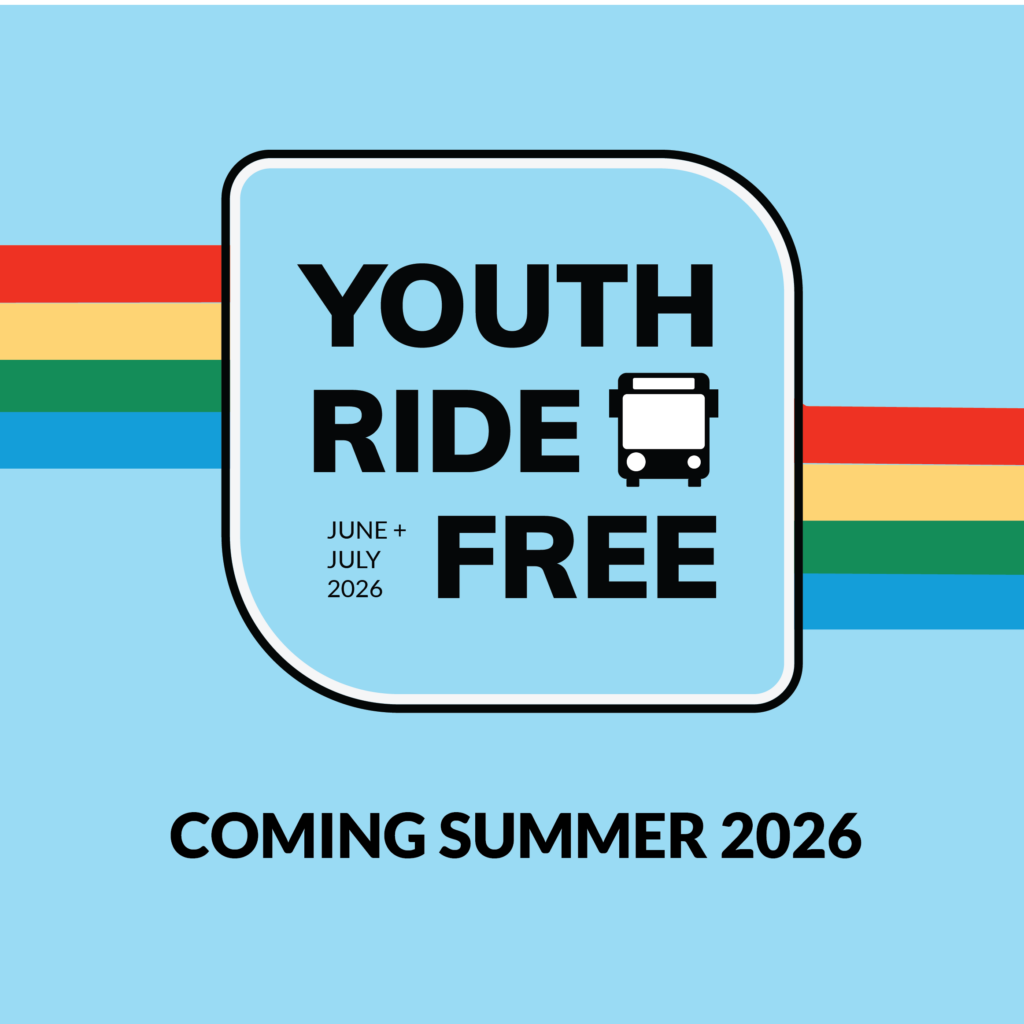
County Connection, who delivers almost three million rides to the region annually, has long worked to advance collaborative transit initiatives. Recent examples include the One Seat Regional Ride program with Tri Delta Transit, WestCAT, and Wheels to provide a transfer-free service for passengers using paratransit within Contra Costa County and the Tri-Valley region; a summer Youth Ride Free program providing free rides to all passengers 18 years and younger within Contra Costa and Alameda Counties, and two pilot programs with MTC’s Regional Mapping and Wayfinding Project to test the implementation of a new unified design for all transit maps and signage across the entire Bay Area region.
About County Connection County Connection provides public transportation services throughout central Contra Costa County, serving approximately 2.8 million riders annually through bus and paratransit services.
Questions or feedback? We’d love to hear your thoughts. Reach out to our Marketing Department at marketing@cccta.org
Contra Costa County, CA — Following a highly successful youth program last summer, County Connection, Tri Delta Transit, and WestCAT will continue the Youth Ride Free program, offering fare-free rides on all fixed-bus routes for youth up to 18 years of age from June 1 through July 31, 2026. County Connection will also extend the Youth Ride Free program to its LINK paratransit service.
With strong participation and widespread grassroots community support, Youth Ride Free has quickly become a cornerstone program for expanding access and mobility for young riders across the three connecting service areas in Contra Costa County. By removing barriers—no fares, applications, IDs, or special passes required—young riders can simply get on board, making transit more accessible than ever.
“The Youth Ride Free program provides a vital mobility option for our youth in eastern Contra Costa,” said CEO Rashidi Barnes. “This valuable initiative allows our young people to participate freely in summer sports and school programs, connect with friends and family, all without relying on a car. Furthermore, as a teenager growing up in the Bay Area, public transportation enabled me to secure a summer job, which helped me support the local economy and develop important life skills.”
Last year alone, Tri Delta Transit transported 40,000 youth during June and July and expects to reach similar ridership levels this year. Recognizing the significant impact of the program, Tri Delta Transit thanks District 3 County Supervisor Diane Burgis and District 5 County Supervisor Shanelle Scales-Preston for their financial commitment, which has ensured the continuation of the 2026 Youth Ride Free program in eastern Contra Costa County.
Says Rob Thompson, General Manager of WestCAT, “Our goal this summer is simple—remove barriers and make it easier for young people to get where they need to go. By offering free rides, we’re supporting opportunity, independence, and stronger connections across our community.”
During last year’s Youth Ride Free pilot, WestCAT saw a 1,170% increase in youth ridership compared to the previous year. In 2025, WestCAT was the only participating agency that required students to show IDs to board—a requirement that did not significantly impact ridership. In 2026, WestCAT will eliminate this requirement, further aligning with the program’s barrier-free approach.
County Connection’s program also demonstrated a transformative impact on youth mobility, with more than 25,000 free rides recorded over two months—an increase of more than 1,600% compared to previous summer programs. This growth was driven in large part by strong community support, including school districts, parents, and local organizations that helped raise awareness and encourage participation.
“I’m very proud of our staff for creating a program that allows our students to ride our buses,” said Robert Storer, Board Chair of County Connection. “When a program takes what was near stagnant youth ridership in the summer months and boosts it to 25,000 rides, as it did with Youth Ride Free, that’s a powerful measure of success. It shows what’s possible when we remove barriers and work closely with our community.”
Beyond increased ridership across all participating agencies, the program also shifted how young people travel, attracting many first-time riders. While Youth Ride Free removes fares for riders, all three agency-led programs are supported through alternative, short-term funding sources.
As Contra Costa and other Bay Area transit agencies navigate an uncertain long-term funding landscape, initiatives like Youth Ride Free represent a strategic investment in cultivating the next generation of transit riders. Building on this momentum, County Connection, Tri Delta Transit, and WestCAT will continue working closely with regional partners to strengthen transit connections and expand opportunities for youth throughout Contra Costa County.
Media Contacts:
County Connection Ryan Jones Manager of Marketing & Communications rjones@cccta.org | 925-680-2037
Tri Delta Transit Leeann Loroño Manager of Customer Service and Marketing llorono@eccta.org | 925-754-6622
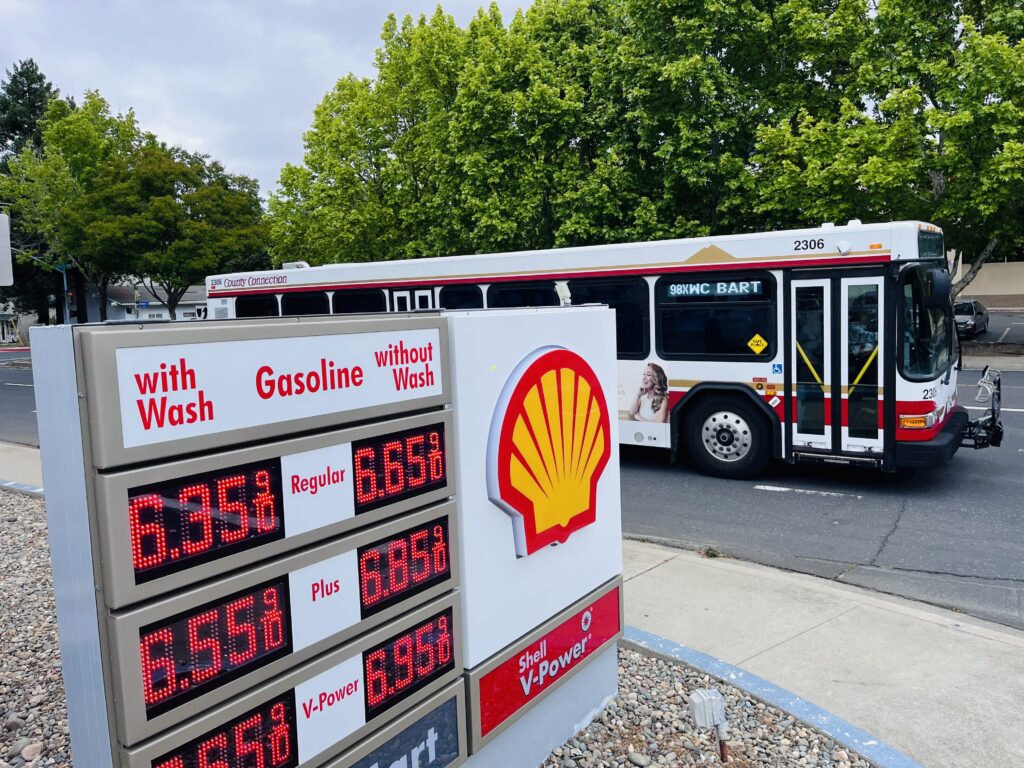
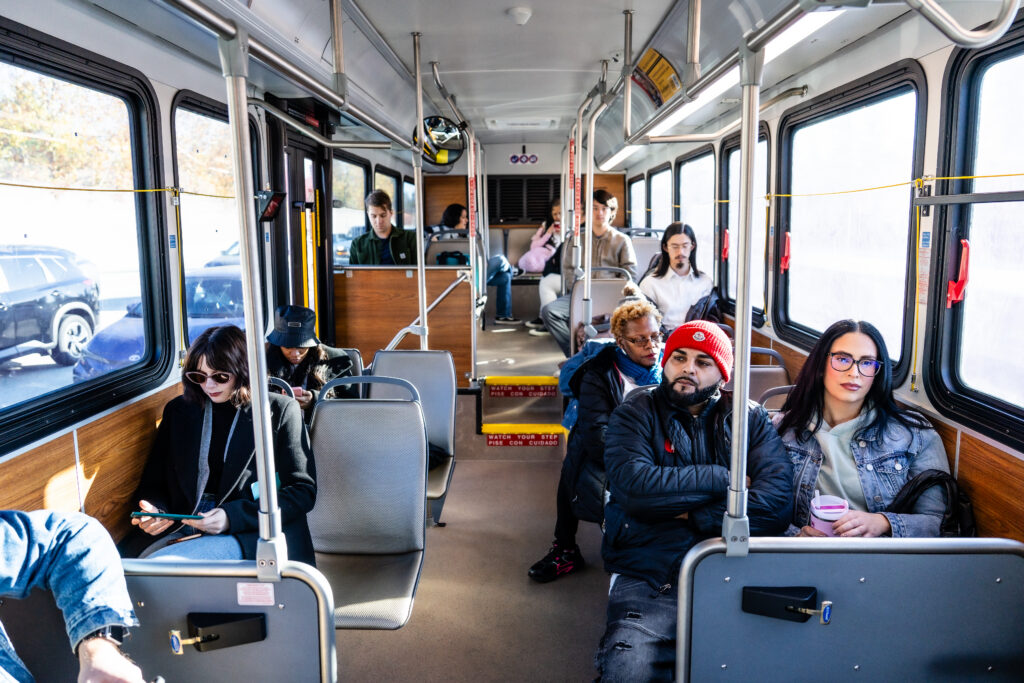
As the cost of living continues to rise, more people are turning to public transit as a practical way to save money while getting where they need to go. Across the Bay Area, ridership is climbing, with BART, Caltrain, and Muni all reporting record-breaking post-pandemic ridership this March. And we’re seeing that same momentum here at County Connection.
While ridership has continued to grow since the pandemic, March saw an unusually large year-over-year increase, with 5% more riders compared to March of last year. In total, nearly 240,000 people rode County Connection in March 2026, with an average of about 9,700 weekday riders—making it our strongest March since 2019.
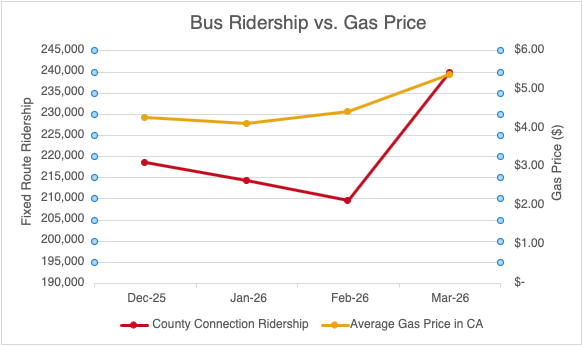
At the same time, we recognize that this growth is closely tied to real financial pressures facing our community. Rising fuel costs, in particular, continue to strain household budgets. According to the U.S. Energy Information Administration, the national average price of gasoline rose from $2.93 per gallon in January 2026 to $4.13 in March—a 41% increase. In California, prices climbed from $4.15 in January to $5.83 in March, a 40% jump. While transit agencies also feel the impact of rising fuel costs, these conditions are prompting more people to consider transit as a reliable and cost-effective alternative.
That shift isn’t limited to the weekday commute. Weekend ridership is also growing, with more people choosing transit for shopping, dining, and recreation. In March, Saturday ridership was 36% higher than in March 2019—the largest post-pandemic increase we’ve seen. These gains highlight transit’s role not just in getting people to work, but in supporting local businesses and contributing to the region’s broader economic recovery.
Table A: The line graph above shows a correlation with the average gas price per gallon in CA since and County Connection ridership from December 2025-March 2026. As the price of gas (yellow line) increases, so does the County Connection ridership (red line).
As demand grows, continued investment in transit will be key to sustaining this momentum and better serving the communities that rely on us every day. And as the cost of living—and especially gas prices—continues to fluctuate, County Connection remains a steady and reliable option, offering affordable, accessible transit since 1980. Whether you’re making the switch for the first time or returning to the bus, we’re here to help you get around central Contra Costa and perhaps give your wallet a well-deserved break.
Questions or feedback? We’d love to hear your thoughts. Reach out to our Marketing Department at marketing@cccta.org!
WHY ARE THERE CHANGES IN SERVICE? County Connection is making time adjustments to some of our routes to better align with neighboring transit agency schedules and improve on time performance. The updated schedules are intended to provide a more seamless transit experience across agencies. If you have questions, contact Customer Service 925-676-7500.
¿POR QUÉ HAY CAMBIOS EN EL SERVICIO? County Connection está haciendo ajustes de tiempo en algunas de nuestras rutas para alinearse mejor con los horarios de las agencias de transporte vecinas y mejorar la puntualidad. Los horarios actualizados están destinados a proporcionar una experiencia de tránsito más fluida entre las agencias. Si tiene preguntas, comuníquese con Servicio al Cliente al 925-676-7500.
Do you have questions or thoughts on the service changes you’d like to share? Email planning@cccta.org and we’ll be glad provide a response or hear what you have to say.
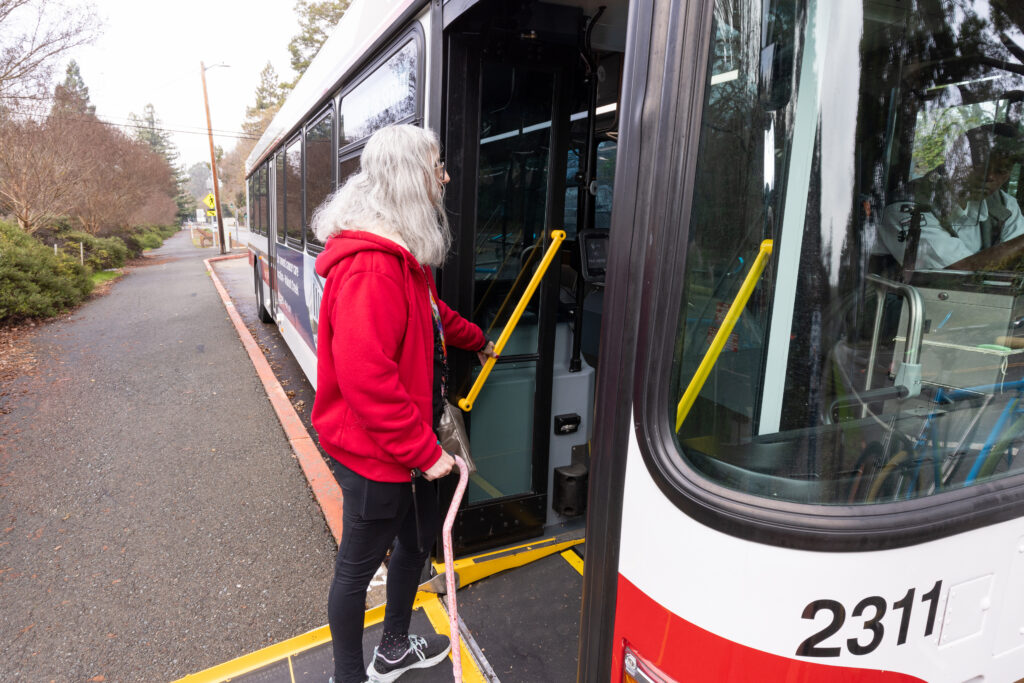
Passenger with a cane alighting a bus via the ramp extension.
Have you noticed how easy it is to step onto a bus these days? Not too long ago, getting on the bus meant climbing up a steep set of stairs, which was not easy for a lot of people.
But for some riders, those steps weren’t just a hassle, they were a barrier. Parents juggling children and strollers, people using canes, and anyone carrying groceries all had to struggle to get on and off. And wheelchair users faced even greater obstacles, relying on slow-moving mechanical lifts, when lifts were available at all. In fact, the first lift-equipped bus route in the United States didn’t begin service until 1977 in San Diego. (Fun fact: in 1989, County Connection became the first public transit agency in the nation to operate a fully lift-equipped bus fleet.)
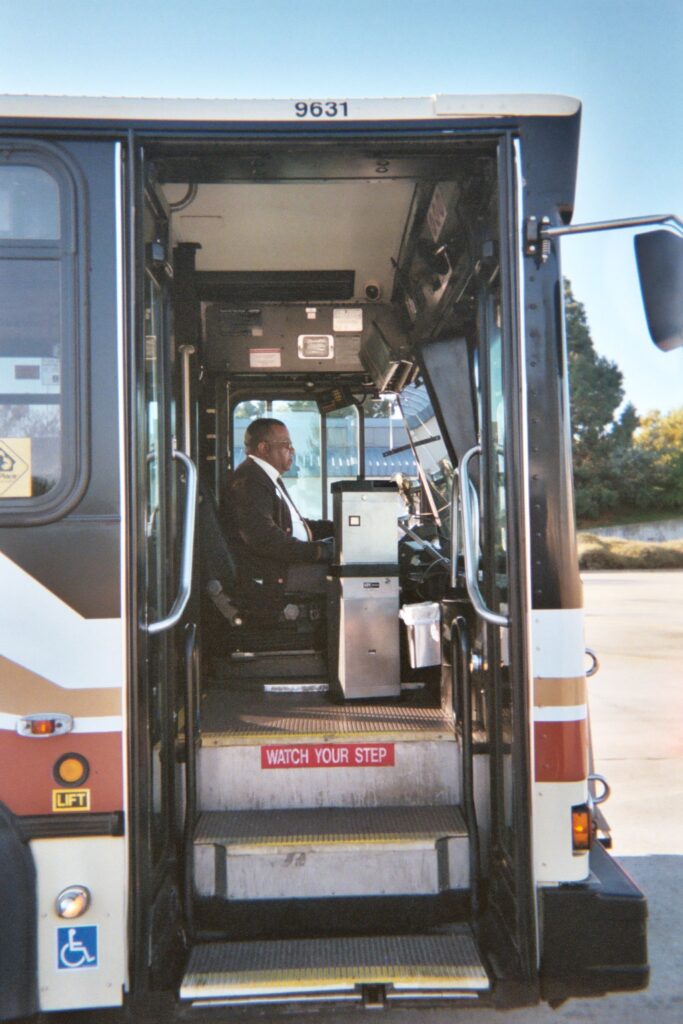
County Connection bus from 90s show stairs passengers would have to climb when entering the bus.
So, what happened to the stairs? Spurred on by the landmark Americans with Disabilities Act in 1990, the first low-floor bus hit the American market in 1991. Today, all major transit bus manufacturers make only low-floor buses, a modern and standardized all-access design. And that gets us to our original question: just what is a low-floor bus?
As the name would suggest, a low-floor bus has a floor that’s closer to the ground, but the real trick is the fold-out ramp, which allows people using wheelchairs, walkers, and other mobility devices to board independently. With the push of a button, the bus operator can quickly deploy a ramp through the front door that creates a smooth path from the sidewalk onto the bus. This simple feature makes boarding faster, easier, and more dignified for everyone.
And that’s the point: accessibility improvements benefit all riders. The same features that help wheelchair users also make life easier for everybody. Think about the sidewalk curb-ramp at a crosswalk when you’re rolling a suitcase or cart, an elevator for someone who has a hard time with stairs, or even the closed captioning on the televisions in a noisy sports bar; these were all features designed for accessibility that ended up helping everyone.
By redesigning the front suspension and steering system to make room for a low floor, modern buses have come a long way towards making transit accessible for everyone (think of it like remodeling a house—moving pipes and wiring behind the walls so you can replace a staircase with a ground-level entry)*. Simply stated, switching from steps to a ramp has improved mobility for millions.
*For all you fellow gearheads out there: Most bus manufacturers did this by replacing the solid front axle with independent front suspension and lowering the steering linkage to make way for the low floor. Not only did this increase passenger accessibility, but it also lowered the center of gravity and improved handling, just like a sports car (a sports bus?).
Andrew Smith is the Director of Planning & Marketing. Do you have question about County Connection? About our buses? About our routes and service? Email asmith@cccta.org and your question might be included in a future issue of our monthly newsletter, Headways.
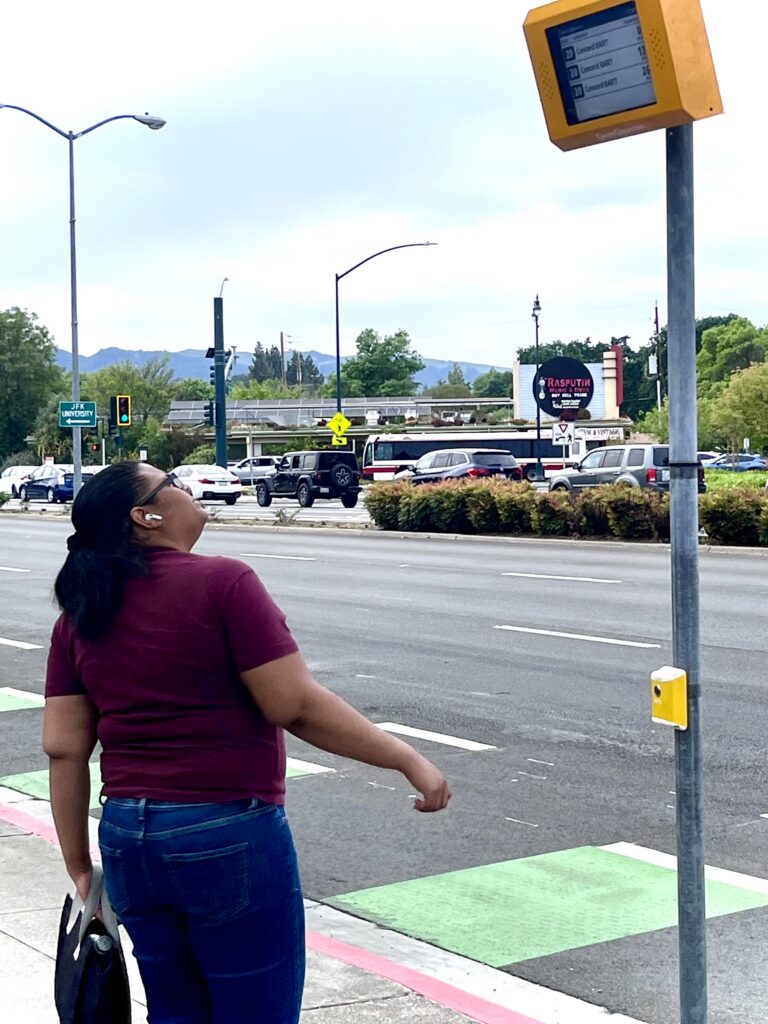
Real-time sign installed along Route 20, displaying County Connection bus arrival times.
Good news for County Connection riders—real-time bus arrival signs are now live at some of our busiest stops across central Contra Costa. If you’ve ever found yourself wondering, “Did I just miss the bus?” or “How much longer do I have to wait?”—we’ve got you covered. Our newly installed signs take the guesswork out of riding. How? They show exactly when your bus will arrive, with updates in real-time, roughly every minute.
This upgrade builds on an earlier set of real-time signs first introduced in 2016. After seeing how helpful those were for riders, we evaluated what was working and looked for ways to make the passenger experience even better. The results are these 28 brand-new, modern displays designed with you—our riders—in mind.
The new signs feature easy-to-read 13-inch e-paper screens (an easy-to-read low-power consumption display, similar to an Amazon Kindle e-reader) that stay clear and visible in all lighting conditions…whether you’re catching an early morning ride or heading home after dark. They’re also built to last, with vandal-resistant enclosures to keep them reliable for the long haul.
Accessibility was a key part of this upgrade. Each sign includes text-to-speech functionality, making it easier for visually impaired riders to hear real-time arrival information with the push of a button (literally).
Push-to-talk feature for visually impaired passengers. Pushing button will activate a voice announcing arrival times of approaching buses.Passenger waiting for County Connection bus, checking the real-time sign for arrival time.
You might notice these signs aren’t solar-powered like the previous ones—and that’s intentional. Advances in battery technology mean these displays can run for three to five years on a single battery, allowing us to install them in more locations without worrying about sun exposure or higher costs.
We’ve placed the 28 signs where they can make the biggest impact by installing them at our stops with the greatest number of boardings. We also made sure to install at least one sign in each of the cities we serve where there is a stop averaging at least ten boardings per day. That means more riders in more places can benefit from real-time information.
You’ll now find these signs in communities including Clayton, Concord, Pleasant Hill, Martinez, Moraga, San Ramon, Walnut Creek (coming soon), and Danville—at key stops along corridors like Clayton Road, Monument Boulevard, Contra Costa Boulevard, and Treat Boulevard, as well as near major destinations like medical centers, park-and-ride lots, and college campuses.
You may notice that stops at BART stations and major transit centers aren’t included just yet. Those locations are part of a larger regional effort led by the Metropolitan Transportation Commission, with updates coming in the future.
This project was funded through County Connection and delivered through a cooperative agreement with the California Association for Coordinated Transportation (CalACT), helping us bring this technology to riders efficiently and cost-effectively. Whether you’reheading to work, school, or anywhere in between, real-time information helps you plan with confidence.
So next time you’re at the stop, take a look up—your bus may be close by (and now you’ll know exactly when it gets there).
Have you seen one of our real-time signs? Whatdya think? We’d love to hear your feedback! Email your thoughts (and even photos of you with a real-time sign) to marketing@cccta.org.
As a genuine transit geek, I could talk all day about what goes on behind the scenes in running a transit system, but the one question we’re asked more than any other is “when is my bus coming?”. We have several ways of letting you know:
Printed timetables
If you want to go old-skool, there’s our tried-and-true printed timetables. Some of you will remember when printed timetables were just about the only way to know when your bus would arrive, and we still provide these on our buses and at libraries, community centers, and city halls (they may also be downloaded from our website). These timetables tell you when the bus is scheduled to arrive at the timepoints along the route (timepoints are bus stops where the bus will stop and wait if it is running ahead of schedule), but you’ll always want to make sure you have the most up-to-date version.
(If you need any printed timetables, they’re available at County Connection, 2477 Arnold Industrial Way in Concord and at various locations around Contra Costa County. Or, you may email us customerservice@cccta.org, and we’ll be glad to mail you what you need.)
Schedule panels
About half of our bus stops have schedule panels showing the arrival times for each route serving that stop (or the previous timepoint for stops that aren’t themselves a timepoint). We typically install schedule panels at bus stops served by more than one route, and at all BART stations and transit centers. They’re a great way to confirm that you’re at the right stop at the right time, but they won’t tell you if the bus is running late. Each timetable is specific to the location of the stop.
Call customer service
We have a dedicated in-house team of friendly and helpful customer service representatives who know all of our routes, are in frequent contact with our dispatchers, can tell you where your bus is, help you plan your trip, or even check to see if something you left on the bus has been turned in to lost & found. You can call them at (925) 676-7500, Monday through Friday between 6:30 am and 6:30 pm. They look forward to hearing from you!
Real-time arrival signs
Here’s where we get into some new technology! We recently installed electronic real-time arrival signs at 28 of our busiest stops, and we have an entire article written about them (See Real-Time Bus Signs Installed for more information and a detailed map of current location of these signs).
County Connection website
Our website has schedules for all of our routes, plus interactive route maps that show the current location of each bus. You can watch your bus as it moves along the route in real time (visit specific route pages), and you can click on your bus stop for real-time arrival estimates. Just visit countyconnection.com and select “Maps & Schedules” from the menu at the top. You can also download our system map to get the overall picture of our entire system (something enjoyed by map nerds such as myself).
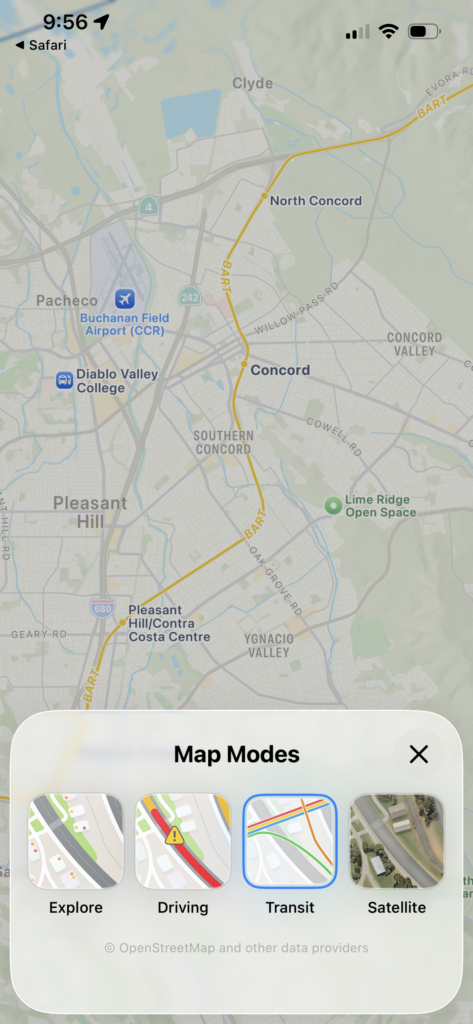
Google/Apple maps
In addition to a trip planner, both apps (Google Maps and Apple Maps) include a public transit map layer (you’ll find it right next to the traffic layer) that features the location of every bus stop and transit station. Tapping on a bus stop will bring up real-time arrival information for every route that stops there.
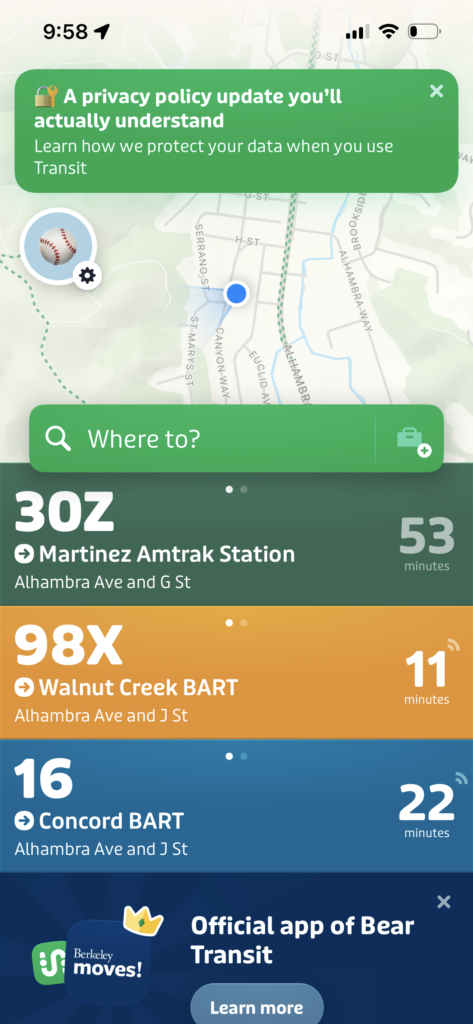
Screenshot of Apple Maps, with options to view transit lines near you.Screenshot of Transit app, displaying all transit options and arrival times of your current location.
Transit app
My personal favorite, the Transit app is designed specifically for transit riders. From the start, it automatically shows you the transit routes closest to your current location and their next arrival time. Clicking on a route opens an interactive route map showing the current location of each bus, its full schedule, and even in some cases how full it is. The app also features a robust trip planning tool that will usually provide you with several options, and it will even tell you when to start walking to your bus stop. Now covering the Bay Area over a decade, the Transit App changed the way I use transit by greatly simplifying trip planning, reassuring me that the bus I’m waiting for is on its way, and even letting me know that I can take a more leisurely walk to my bus stop if it’s running a few minutes late. I recently used the app to take a trip to South San Francisco that included County Connection, BART, Muni, and Caltrain (with seamless connections between all four operators), and over the years I’ve used the app across the United States and abroad (because of course I take transit when I travel!).
We’ve come a long way from the days when you had to find a printed schedule and then wait at the bus stop, not knowing where your bus was until you could see it up the block. Online tools have greatly improved my transit experience, and they will likely do the same for you!
Please note: this article is not sponsored by Google, Apple, or the Transit App.
Andrew Smith is the Director of Planning & Marketing. Do you have question about County Connection? About our buses? About our routes and service? Email asmith@cccta.org and your question might be included in a future issue of our monthly newsletter, Headways.
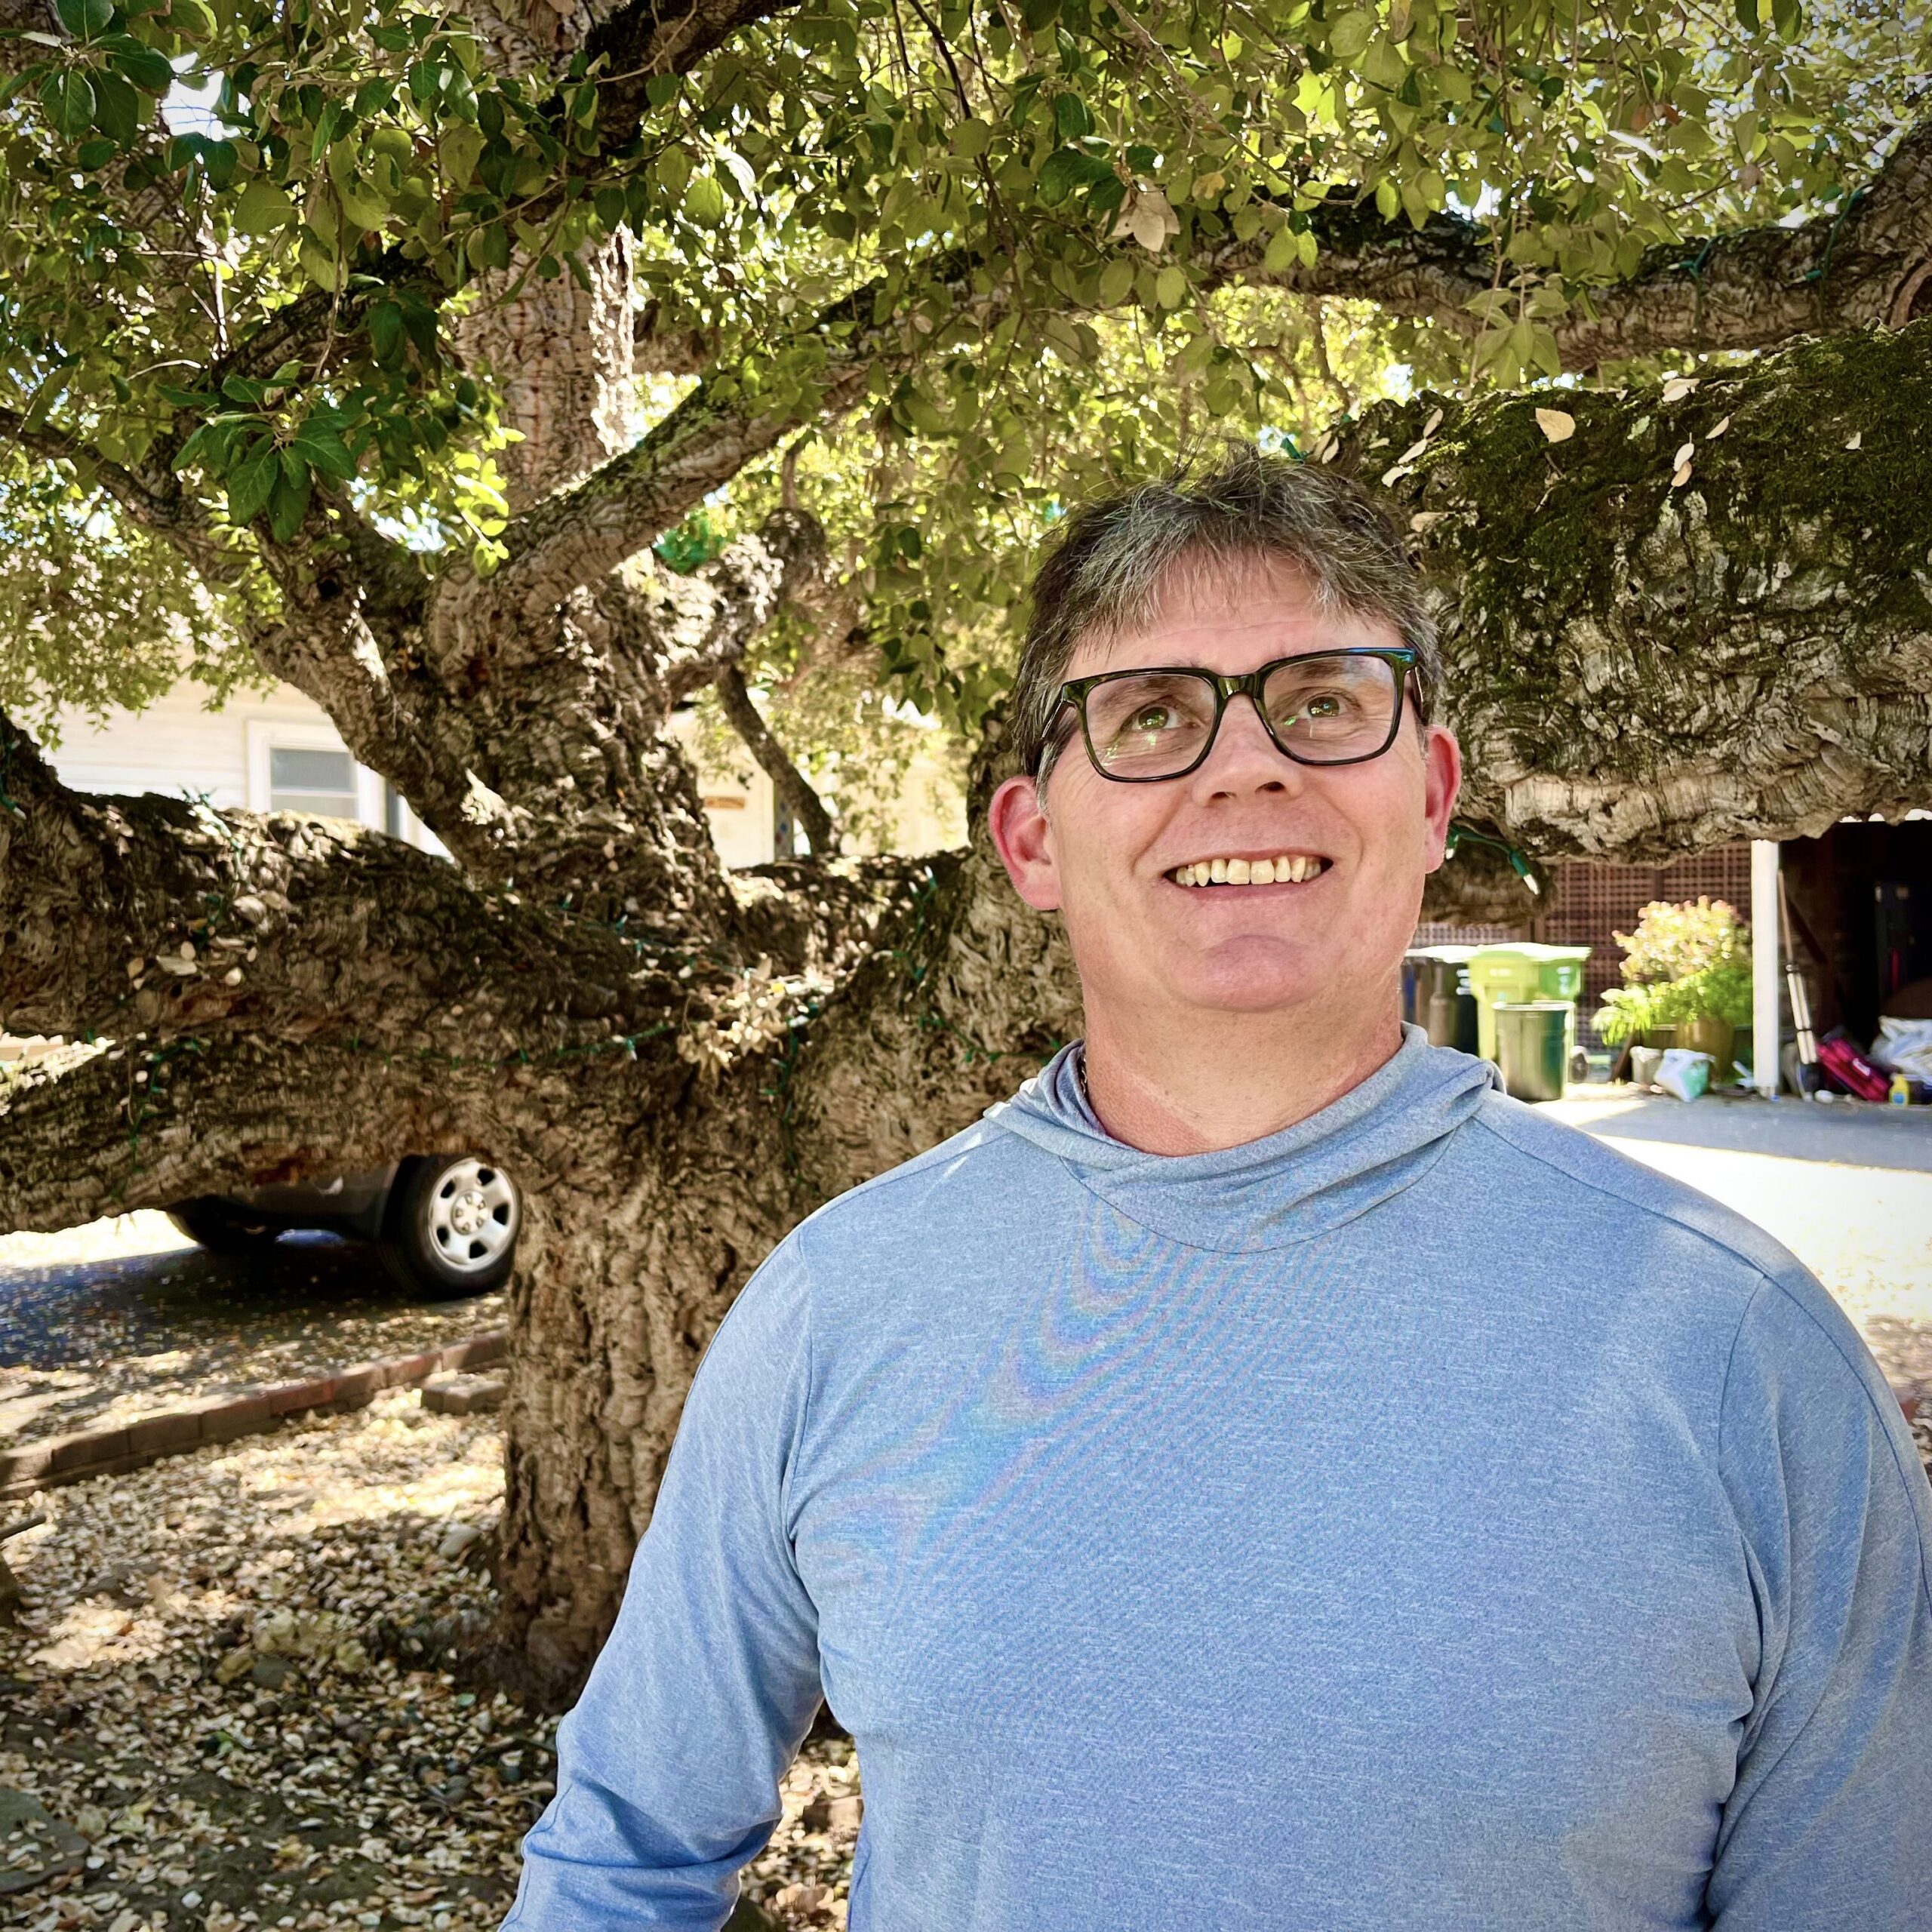
Ian at home in Walnut Creek, standing in front of a 100+ year old cork oak tree.
Ian McLaughlin once lived a life defined by movement—both physically and professionally. Raised in Santa Rosa, California, he built a career in law and public policy, focusing on improving public health in underserved communities. He was deeply engaged in civic life, served on Walnut Creek’s Park, Recreation, and Open Space Commission, and stayed active as a tennis player, backpacker, and coach for his sons’ youth sports teams. Alongside his wife, Starr, and their two boys, Ian’s life was full, active, and rooted in community.
In September 2016, that life changed in an instant.
While attending a conference in Atlanta, Ian suffered a series of three strokes over two days; the first came shortly after he delivered a presentation. By the next morning, Ian experienced a massive stroke and was later airlifted to a specialized stroke center, where surgeons performed emergency brain surgery to remove blood clots. During the procedure, he suffered the third stroke and spent nearly a month in a coma.
When Ian returned to California, he faced a new reality: he was completely paralyzed on the left side of his body. He could not walk or perform even basic daily tasks independently. Multiple surgeries followed, including a long and uncertain process to reconstruct part of his skull, which had been removed to reduce brain swelling. The physical challenges were immense—but the emotional adjustment proved just as difficult.
After months in a rehabilitation hospital, Ian returned home, where the weight of his new limitations fully set in. Once independent and constantly active, he now relied on caregivers for nearly everything.“It felt like my previous life was gone,” he recalls. Isolation and depression became significant hurdles in his recovery.
Each day was filled with physical, occupational, and speech therapy. Progress came in small increments—learning to transfer from a bed to a chair, taking a few assisted steps, gradually regaining balance and coordination. Ian began to embrace what would become his guiding philosophy: progress happens “inch by inch.”
But regaining mobility inside the home was only part of the journey. Re-entering the community—and doing so independently—was another challenge entirely. For the first couple of years, Ian depended on caregivers not only for daily needs but also for transportation. While necessary, this level of dependence was costly and emotionally difficult. Ian longed to regain the ability to go places on his own.
Because of vision loss caused by his strokes, driving was no longer an option, and rideshare services were expensive. Then, Ian learned about paratransit services available in his community, offered through County Connection Link Paratransit, a shared-ride service for those unable to use regular buses due to disability or serious health conditions. “That discovery changed everything,” he says.
Ian began using paratransit to travel independently for the first time since his strokes. What might seem like a simple service became a transformative milestone in his recovery. “It opened up a whole new world,” Ian explains. “I could go to appointments, therapy, even run errands—on my own schedule, without needing someone with me.”
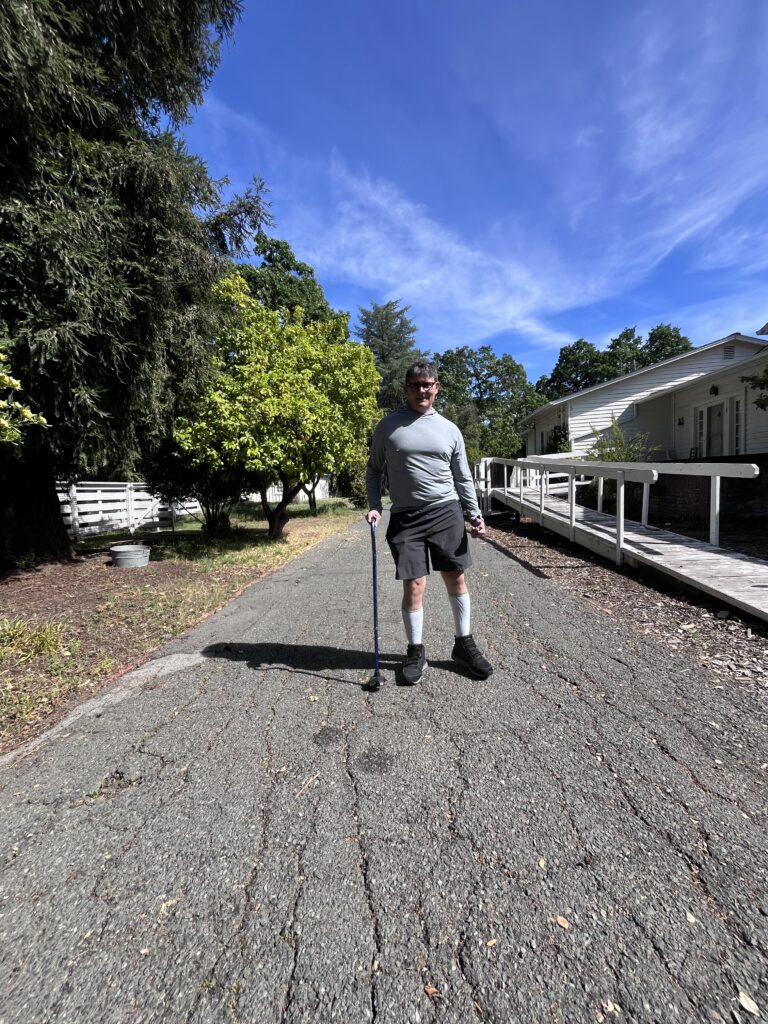
At first, using the service required courage. Ian was still regaining confidence in his mobility and often brought his wheelchair along, even as he practiced walking with a cane. Paratransit operators helped him safely board and exit the vehicle, treating him with professionalism and respect. Over time, as his strength and balance improved, he began traveling with just his cane (another sign of progress).
Beyond the practical benefits, public transportation restored something deeper: a sense of agency. “Just being able to make decisions for myself again—where to go, when to leave—that was huge,” he says. “It made me feel like part of the world again.”
Paratransit became a critical tool in Ian’s ongoing recovery, enabling him to stay engaged in his community, continue rehabilitation, and rebuild independence step by step. It also provided a cost-effective alternative to private transportation, making regular outings sustainable.
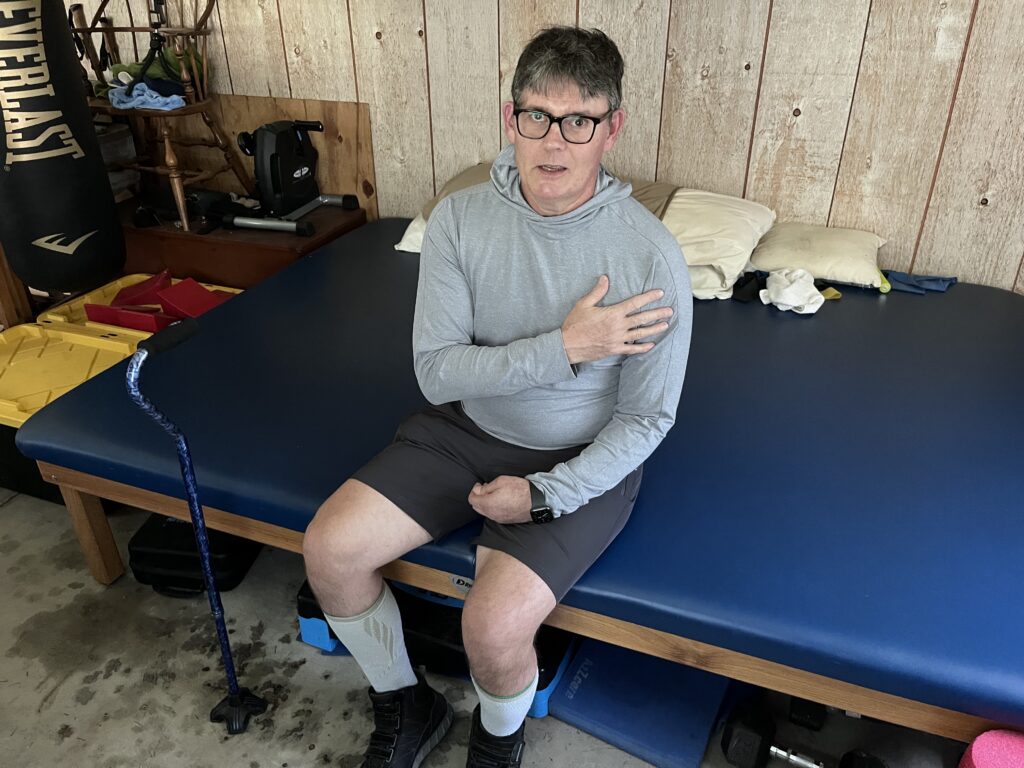
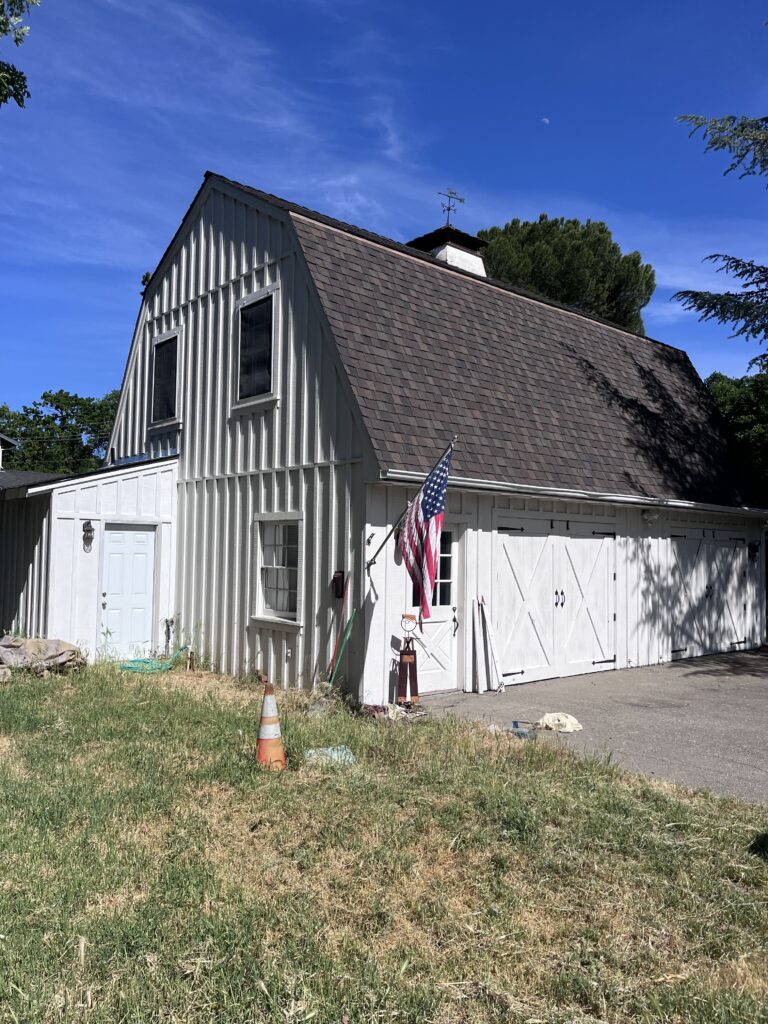
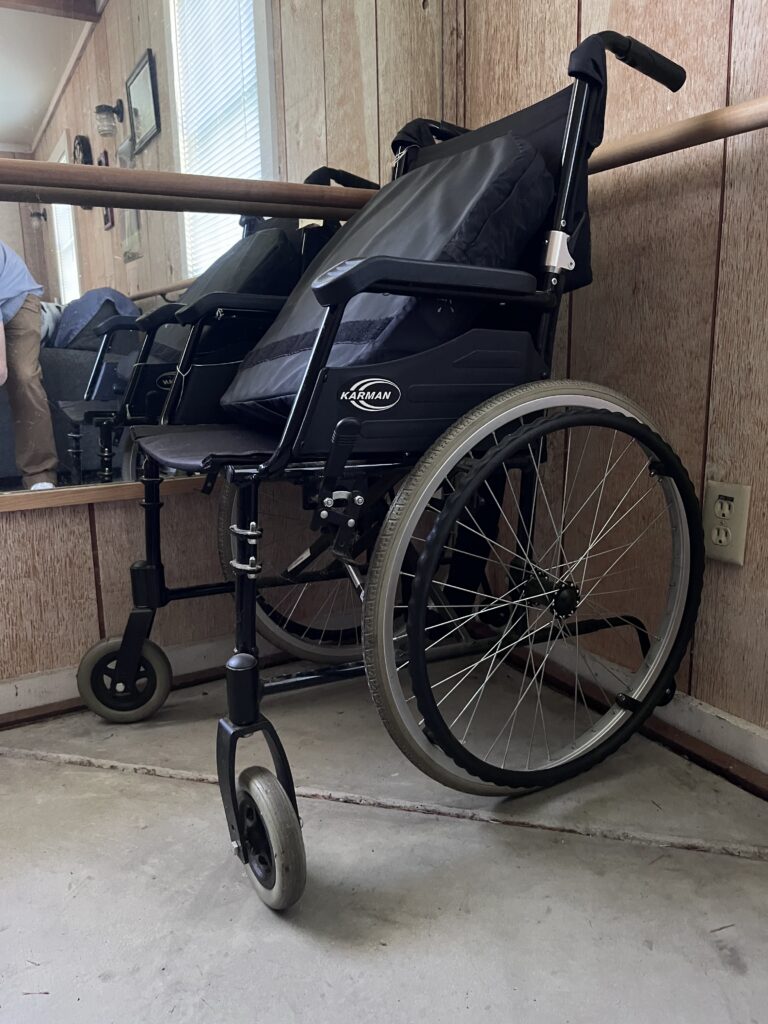
Ian sitting on a padded platform mat used for rehabilitation exercises.Barn converted into a rehabilitation area and place where Ian learned to walk again.Wheelchair now collecting dust in the rehabilitation barn.Ian walking down his driveway.Ian with his newly acquired and custom built recumbent bike, allowing for new freedoms and independence.
Today, Ian continues to set new goals. One of his next milestones is to try regular bus services and eventually navigate systems like regional rail on his own—challenges he sees as opportunities to keep growing.
For others facing mobility or cognitive challenges, Ian offers encouragement: don’t hesitate to explore public transportation options.“The process is much easier than you might expect,” he says. “The operators are compassionate, patient, and well-trained. They make it feel safe and dignified.”
Ian’s journey is ultimately one of resilience—not just in relearning how to walk, but in reclaiming independence and identity. His advice to others facing life-altering setbacks is simple: practice patience, stay positive, and remain persistent. Progress may be slow. But as Ian’s story shows, even the smallest steps forward can lead to something life changing. In his case, those steps were made possible not only by determination and support, but by something as simple as accessible public transit.
You can learn more about Ian McLaughlin’s story in his book, Inch by Inch: My Journey of Recovery and Discovery After, available on Amazon. If you or someone you know is interested in County Connection Link Paratransit services, please visit countyconnection.com/paratransit for details on paratransit services in central Contra Costa County.
Are you a transit enthusiast? Casual rider? We’d love to share your perspective on how public transit shapes your day. Reach out to our Marketing Department at marketing@cccta.org and let us know about your story!