As the cost of living continues to rise, more people are turning to public transit as a practical way to save money while getting where they need to go. Across the Bay Area, ridership is climbing, with BART, Caltrain, and Muni all reporting record-breaking post-pandemic ridership this March. And we’re seeing that same momentum here at County Connection.
While ridership has continued to grow since the pandemic, March saw an unusually large year-over-year increase, with 5% more riders compared to March of last year. In total, nearly 240,000 people rode County Connection in March 2026, with an average of about 9,700 weekday riders—making it our strongest March since 2019.
At the same time, we recognize that this growth is closely tied to real financial pressures facing our community. Rising fuel costs, in particular, continue to strain household budgets. According to the U.S. Energy Information Administration, the national average price of gasoline rose from $2.93 per gallon in January 2026 to $4.13 in March—a 41% increase. In California, prices climbed from $4.15 in January to $5.83 in March, a 40% jump. While transit agencies also feel the impact of rising fuel costs, these conditions are prompting more people to consider transit as a reliable and cost-effective alternative.
That shift isn’t limited to the weekday commute. Weekend ridership is also growing, with more people choosing transit for shopping, dining, and recreation. In March, Saturday ridership was 36% higher than in March 2019—the largest post-pandemic increase we’ve seen. These gains highlight transit’s role not just in getting people to work, but in supporting local businesses and contributing to the region’s broader economic recovery.
Table A: The line graph above shows a correlation with the average gas price per gallon in CA since and County Connection ridership from December 2025-March 2026. As the price of gas (yellow line) increases, so does the County Connection ridership (red line).
As demand grows, continued investment in transit will be key to sustaining this momentum and better serving the communities that rely on us every day. And as the cost of living—and especially gas prices—continues to fluctuate, County Connection remains a steady and reliable option, offering affordable, accessible transit since 1980. Whether you’re making the switch for the first time or returning to the bus, we’re here to help you get around central Contra Costa and perhaps give your wallet a well-deserved break.
Questions or feedback? We’d love to hear your thoughts. Reach out to our Marketing Department at marketing@cccta.org!
Passenger with a cane alighting a bus via the ramp extension.
Have you noticed how easy it is to step onto a bus these days? Not too long ago, getting on the bus meant climbing up a steep set of stairs, which was not easy for a lot of people.
But for some riders, those steps weren’t just a hassle, they were a barrier. Parents juggling children and strollers, people using canes, and anyone carrying groceries all had to struggle to get on and off. And wheelchair users faced even greater obstacles, relying on slow-moving mechanical lifts, when lifts were available at all. In fact, the first lift-equipped bus route in the United States didn’t begin service until 1977 in San Diego. (Fun fact: in 1989, County Connection became the first public transit agency in the nation to operate a fully lift-equipped bus fleet.)
County Connection bus from 90s show stairs passengers would have to climb when entering the bus.
So, what happened to the stairs? Spurred on by the landmark Americans with Disabilities Act in 1990, the first low-floor bus hit the American market in 1991. Today, all major transit bus manufacturers make only low-floor buses, a modern and standardized all-access design. And that gets us to our original question: just what is a low-floor bus?
As the name would suggest, a low-floor bus has a floor that’s closer to the ground, but the real trick is the fold-out ramp, which allows people using wheelchairs, walkers, and other mobility devices to board independently. With the push of a button, the bus operator can quickly deploy a ramp through the front door that creates a smooth path from the sidewalk onto the bus. This simple feature makes boarding faster, easier, and more dignified for everyone.
And that’s the point: accessibility improvements benefit all riders. The same features that help wheelchair users also make life easier for everybody. Think about the sidewalk curb-ramp at a crosswalk when you’re rolling a suitcase or cart, an elevator for someone who has a hard time with stairs, or even the closed captioning on the televisions in a noisy sports bar; these were all features designed for accessibility that ended up helping everyone.
By redesigning the front suspension and steering system to make room for a low floor, modern buses have come a long way towards making transit accessible for everyone (think of it like remodeling a house—moving pipes and wiring behind the walls so you can replace a staircase with a ground-level entry)*. Simply stated, switching from steps to a ramp has improved mobility for millions.
*For all you fellow gearheads out there: Most bus manufacturers did this by replacing the solid front axle with independent front suspension and lowering the steering linkage to make way for the low floor. Not only did this increase passenger accessibility, but it also lowered the center of gravity and improved handling, just like a sports car (a sports bus?).
Andrew Smith is the Director of Planning & Marketing. Do you have question about County Connection? About our buses? About our routes and service? Email asmith@cccta.org and your question might be included in a future issue of our monthly newsletter, Headways.
As a genuine transit geek, I could talk all day about what goes on behind the scenes in running a transit system, but the one question we’re asked more than any other is “when is my bus coming?”. We have several ways of letting you know:
Printed timetables
If you want to go old-skool, there’s our tried-and-true printed timetables. Some of you will remember when printed timetables were just about the only way to know when your bus would arrive, and we still provide these on our buses and at libraries, community centers, and city halls (they may also be downloaded from our website). These timetables tell you when the bus is scheduled to arrive at the timepoints along the route (timepoints are bus stops where the bus will stop and wait if it is running ahead of schedule), but you’ll always want to make sure you have the most up-to-date version.
(If you need any printed timetables, they’re available at County Connection, 2477 Arnold Industrial Way in Concord and at various locations around Contra Costa County. Or, you may email us customerservice@cccta.org, and we’ll be glad to mail you what you need.)
Schedule panels
About half of our bus stops have schedule panels showing the arrival times for each route serving that stop (or the previous timepoint for stops that aren’t themselves a timepoint). We typically install schedule panels at bus stops served by more than one route, and at all BART stations and transit centers. They’re a great way to confirm that you’re at the right stop at the right time, but they won’t tell you if the bus is running late. Each timetable is specific to the location of the stop.
Call customer service
We have a dedicated in-house team of friendly and helpful customer service representatives who know all of our routes, are in frequent contact with our dispatchers, can tell you where your bus is, help you plan your trip, or even check to see if something you left on the bus has been turned in to lost & found. You can call them at (925) 676-7500, Monday through Friday between 6:30 am and 6:30 pm. They look forward to hearing from you!
Real-time arrival signs
Here’s where we get into some new technology! We recently installed electronic real-time arrival signs at 28 of our busiest stops, and we have an entire article written about them (See Real-Time Bus Signs Installed for more information and a detailed map of current location of these signs).
County Connection website
Our website has schedules for all of our routes, plus interactive route maps that show the current location of each bus. You can watch your bus as it moves along the route in real time (visit specific route pages), and you can click on your bus stop for real-time arrival estimates. Just visit countyconnection.com and select “Maps & Schedules” from the menu at the top. You can also download our system map to get the overall picture of our entire system (something enjoyed by map nerds such as myself).
Google/Apple maps
In addition to a trip planner, both apps (Google Maps and Apple Maps) include a public transit map layer (you’ll find it right next to the traffic layer) that features the location of every bus stop and transit station. Tapping on a bus stop will bring up real-time arrival information for every route that stops there.
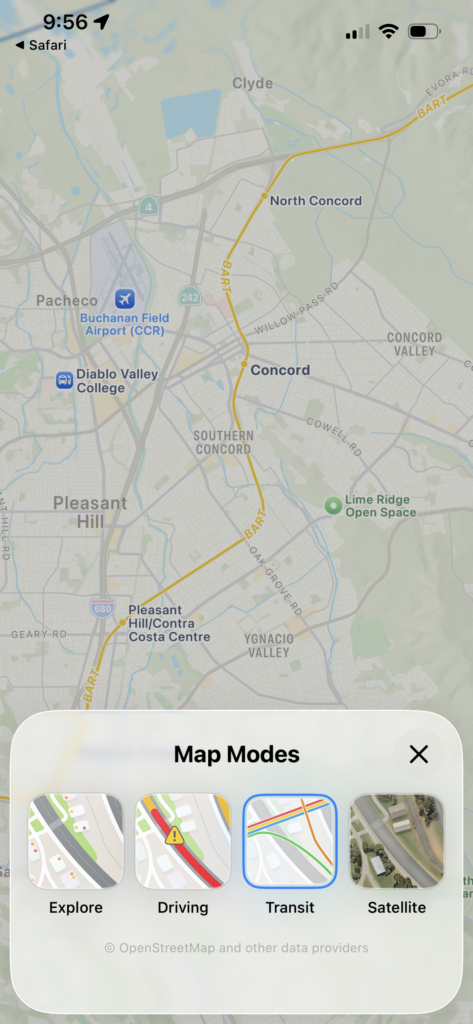
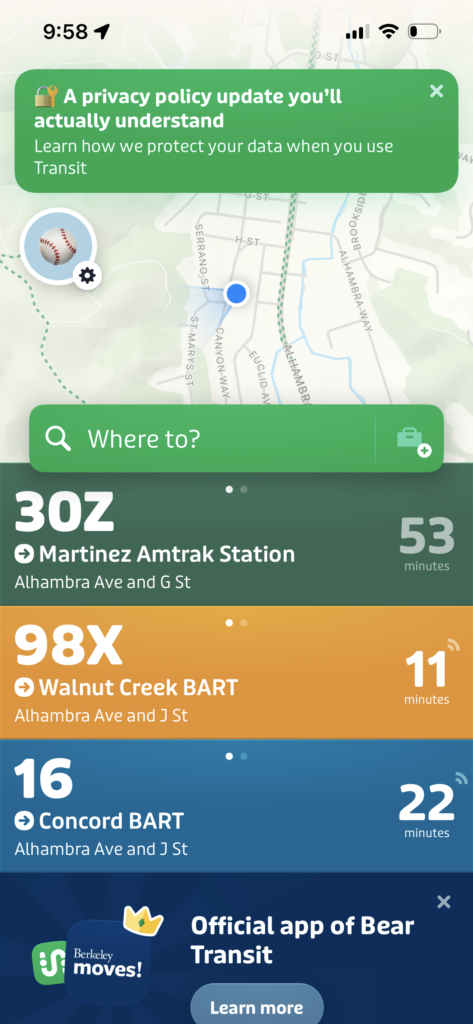
Screenshot of Apple Maps, with options to view transit lines near you.Screenshot of Transit app, displaying all transit options and arrival times of your current location.
Transit app
My personal favorite, the Transit app is designed specifically for transit riders. From the start, it automatically shows you the transit routes closest to your current location and their next arrival time. Clicking on a route opens an interactive route map showing the current location of each bus, its full schedule, and even in some cases how full it is. The app also features a robust trip planning tool that will usually provide you with several options, and it will even tell you when to start walking to your bus stop. Now covering the Bay Area over a decade, the Transit App changed the way I use transit by greatly simplifying trip planning, reassuring me that the bus I’m waiting for is on its way, and even letting me know that I can take a more leisurely walk to my bus stop if it’s running a few minutes late. I recently used the app to take a trip to South San Francisco that included County Connection, BART, Muni, and Caltrain (with seamless connections between all four operators), and over the years I’ve used the app across the United States and abroad (because of course I take transit when I travel!).
We’ve come a long way from the days when you had to find a printed schedule and then wait at the bus stop, not knowing where your bus was until you could see it up the block. Online tools have greatly improved my transit experience, and they will likely do the same for you!
Please note: this article is not sponsored by Google, Apple, or the Transit App.
Andrew Smith is the Director of Planning & Marketing. Do you have question about County Connection? About our buses? About our routes and service? Email asmith@cccta.org and your question might be included in a future issue of our monthly newsletter, Headways.
Have you ever looked at a bus timetable and thought, “Geez, that looks complicated”? You’re not wrong. A bus schedule contains a lot of information. But every line, timepoint, and column is carefully designed to help you plan your trip by time and location. Here’s a look at what goes into building one.
Creating a bus schedule is about far more than timing how long it takes to drive a route. Yes, driving the route provides a baseline. But that’s just the beginning. Schedulers also have to add time spent at bus stops (how long it takes for passengers to board/disembark), figuring that some stops will be busier than others, and at different times of the day. And don’t forget red lights, left turns, and stop signs!
Then there’s traffic congestion, which can vary throughout the day both in location and direction. For example, during the morning rush hour, traffic backs up going westbound on Ygnacio Valley Road, but in the evening, it backs up going eastbound, and not always on the same stretch of road. There’s also heavier traffic in both directions around lunchtime, but not in all the same places as during rush hour. And don’t forget about schools! Traffic backs up at the beginning and end of the school day because of parents dropping off their kids, and kids using the crosswalk (which means longer and more frequent red lights). And of course, everything changes when school is out for the summer or on spring break (and not every school has the same schedule!). Add holiday shoppers (traffic around Sunvalley Shopping Center, for example), road construction, weather, and weekend traffic patterns, and the variables multiply quickly.
The reality is that travel times are never exactly the same twice. For that reason, schedulers have to add additional time, or “padding” to account for this. Padding is extra time built into a schedule that helps even out the variations in traffic or other delays that the bus might experience along its route.
County Connection’s individual bus routes all come together to form a regional network, so we also need to plan our schedules to accommodate transfers between different routes, not to mention BART. It’s common for us to “pulse” at our major terminals, meaning several buses arrive and depart around the same time to make transfers easier. But synchronizing routes can be challenging when some take longer to operate or run more frequently than others.
And last but certainly not least, we have to think of our bus operators. The bus is their workplace, their office, so to speak, but it doesn’t include a restroom or a lunchroom. So, we have to build time into our schedules for our operators to take their breaks and to access the restroom. And the time it takes to walk from the bus stop to the restroom can vary a lot – looking at you, Dublin/Pleasanton BART station!
You can think of a bus schedule as a giant algebra equation with a million variables, where solving for X means the bus arrives on time. Yet it’s something we do for each of our 53 routes, updated four times a year! If we’ve done our job right — if all those variables have been factored in and the math adds up — then your trip should feel predictable, reliable, and maybe even a little bit easy. You just show up, check the time, and go. Behind the scenes, we’ll keep solving for X so you can focus on getting where you need to be.
Andrew Smith is the Director of Planning & Marketing. Do you have question about County Connection? About our buses? About our routes and service? Email asmith@cccta.org and your question might be included in a future issue of our monthly newsletter, Headways.
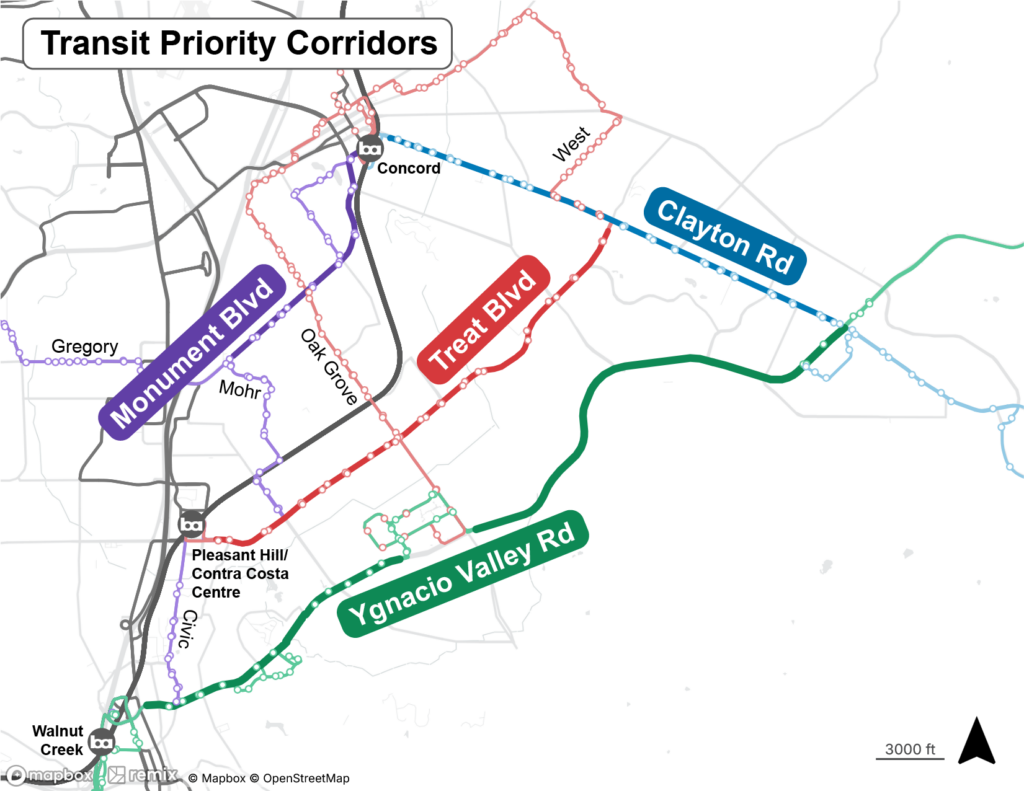
County Connection has completed a major Transit Corridor Study focused on one clear goal: making bus service faster, more reliable, and easier to use along some of our busiest corridors. The study examined four key streets in central Contra Costa County:
Clayton Road (Routes 10, 15, 310, 315): Served by County Connection’s second-highest ridership route.
Monument Boulevard (Routes 14, 16, 314): High transit propensity, serving an Equity Priority Community and an SB 535 Disadvantaged Community.
Ygnacio Valley Road (Routes 1, 92X, 93X, 301): A congested corridor with healthcare, employment, retail, and some high-density housing, offering strong potential for transit development.
As traffic congestion has increased in recent years, buses have experienced longer and less predictable travel times. Riders told us they feel the impact: missed connections, inconsistent arrival times, and frustration when trips take longer than expected. This study was designed to understand exactly where delays occur — and identify practical, cost-effective solutions to fix them.
What information did our survey find?
The analysis showed that each corridor faces different challenges. Ygnacio Valley Road experiences the longest delays per trip because of heavy congestion and long waits at intersections. Treat Boulevard and Monument Boulevard have the highest overall passenger delay, meaning the greatest number of riders are affected by slowdowns. Clayton Road experiences steady, moderate delays, especially near major intersections.
One important takeaway is that transit challenges are not the same everywhere. Each corridor needs targeted improvements based on how and where delays occur.
Just as importantly, riders shared that reliability matters as much as speed. In our survey of more than 330 community members, people consistently emphasized the importance of dependable schedules, smooth BART connections, and safer, more accessible bus stops. Faster trips are important — but predictable service and a comfortable waiting environment matter just as much.
What will make the biggest difference?
The study found that traffic signals are one of the biggest causes of delay — and one of the biggest opportunities for improvement.
When buses stop at multiple red lights or get caught in long lines at intersections, travel times quickly add up. Adjusting signal timing, coordinating signals along entire corridors, and adding Transit Signal Priority (which allows buses to communicate with traffic signals to extend the green or shorten the red) can significantly reduce those delays. In some locations, adding short “queue jump” lanes (which let buses jump ahead of cars at traffic signals) or part-time bus-only lanes can help buses move ahead of traffic. These types of improvements consistently showed the strongest benefits in our analysis.
If fully implemented, the recommended improvements could reduce travel times by approximately 1½ to 4 minutes per trip on Clayton Road, Monument Boulevard, and Treat Boulevard — and up to 6 minutes per trip on Ygnacio Valley Road. While that may not sound dramatic at first, those minutes add up quickly across thousands of riders every day. More importantly, they create more reliable schedules and fewer missed connections.
Changes will happen in phases
The study outlines a clear roadmap for moving forward. The greatest improvements occur when strategies are combined. Updating signals, improving bus stop spacing, and adding targeted bus priority improvements work together to create meaningful, systemwide benefits. This phased approach allows County Connection to begin with high-impact, cost-effective strategies while planning for larger investments over time.
For many customers, small improvements in reliability can make the difference between catching a train on time or missing it. Over time, faster and more dependable service can also encourage more people to choose transit.
What happens next?
With the study complete, County Connection will begin working with local cities and partner agencies to refine designs, coordinate with planned roadway projects, and pursue funding for implementation. Signal-focused improvements will likely move forward first because they offer strong benefits relative to cost.
By combining technical analysis with rider feedback, County Connection is focused on delivering faster trips, more reliable schedules, safer stops, and stronger connections to BART and the broader community. As projects advance, County Connection will continue communicating with riders and the community to share updates and next steps.
Do you have questions or thoughts on this article you’d like to share? Email planning@cccta.org and we’ll be glad provide a response or hear what you have to say.
Have you ever wondered what actually powers a County Connection bus? Our fleet includes 125 buses: Eight of them are fully electric, while the remaining 117 run on diesel fuel—specifically, renewable diesel. If you’ve never heard of renewable diesel, don’t worry, we’ll break it down for you (and explain why renewable diesel is a big step towards a zero-emission fleet).
Unlike traditional diesel, which is made from petroleum, renewable diesel is made from natural, renewable sources like oils and fats from plants and animals. In the fuel industry, these materials are sometimes called feedstocks.The important thing to know is this: renewable diesel can replace regular diesel one-for-one, with no engine modifications required. That’s a big advantage. Other alternatives, like biodiesel, are typically sold as a 20% blend with regular diesel – any more than that requires significant and often pricy engine modifications due to corrosion.
Beyond where it comes from, renewable diesel has another major benefit—it burns much cleanerand has a far smaller ecological footprint! When taking into account the total lifecycle emissions resulting from the manufacture, transportation, and use of each fuel, renewable diesel generates about 65% fewer greenhouse gas (GHG) emissions than regular diesel. That’s a significant reduction in climate-impacting pollution.
And greenhouse gases aren’t the only concern. Bus exhaust also contains tiny particles, called particulate matter, which can affect air quality and human health. Renewable diesel helps here, too, producing 35–40% fewer particulate emissions than traditional diesel. As a bonus, its clean-burning nature is why you’ll barely notice any exhaust smell—and why County Connection buses’ tailpipes are so clean, even after years of use.
We believe the future of transportation is electric, however, unlike personal vehicles such as bicycles, automobiles, and pickup trucks, the technology is still evolving for large commercial vehicles like transit buses (perhaps a topic for a future Ask Andy?). County Connection’s use of renewable diesel represents a positive interim step while we move towards an electrified future. Until that day comes, renewable diesel is helping us drive cleaner, right now. And remember, any time you take the bus instead of a car, you’re helping the environment no matter what fuel is being used.
Andrew Smith is the Director of Planning & Marketing. Do you have question about County Connection? About our buses? About our routes and service? Email asmith@cccta.org and your question might be included in a future issue of our monthly newsletter, Headways.
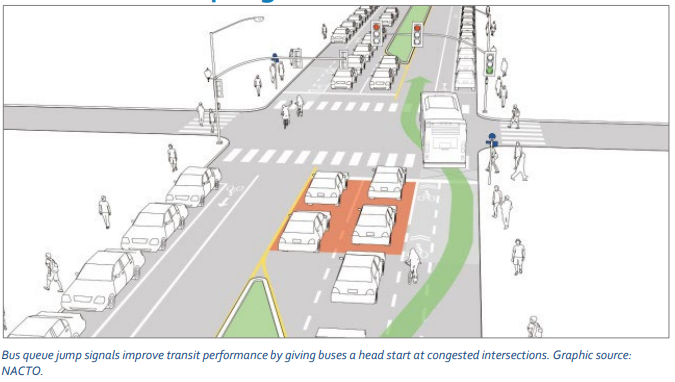
We are often asked why we don’t use our shorter buses systemwide during the quieter periods of the day, or on routes with lower ridership, to save money or fuel. The answer is more complex than it might seem!
With very few exceptions, every route has at least one or two times a day when the bus is full, leaving room only for people to stand. On some routes this may be during the traditional morning or evening commute period, while on other routes it may be when a nearby school starts or ends its day. As much as possible, we use buses large enough to provide a seat for every passenger during these busy periods.
For us to swap out one sized bus for another, we would need to take the first bus and its operator out of service to drive back to our facility in North Concord, check out a new bus, and drive that one back to its route. This can be very time-consuming. In addition to the extra time and mileage for the coach exchange, we would need to send out another bus and driver to cover the route during the switch. And remember that this would need to be done multiple times each day for most routes, and we would need to buy a lot more buses!
The good news is that it costs us almost the same to operate a bus regardless of its length. Transit buses are generally available in four different lengths: 30, 35, and 40-foot standard buses, and 60-foot articulated buses (the ones that bend in the middle like an accordion). Two-thirds of County Connection’s fleet of 125 buses are 40-footers, with the rest being 30 or 35 feet long and used on routes with narrow streets and sharp curves.
Every bus needs a driver, and every bus has the same engine, two doors, and six wheels. The purchase price is also very similar, with a 40-foot bus costing only 6% more than a 30-foot bus, and fuel mileage is almost identical regardless of the length of bus. Don’t forget too that the more people who ride the bus, the fewer cars on the road and less fuel used. In short, keeping standard-sized buses on the road ensures consistent service and efficiency throughout the day. So next time, take the bus!
Andrew Smith is the Director of Planning & Marketing. Do you have question about County Connection? About our buses? About our routes and service? Email asmith@cccta.org and your question might be included in a future issue of our monthly newsletter, Headways.
Election Day is November 5 and as the date approaches, if you plan on voting in person, it’s important to know where to find your polling place. Knowing where to go will help you avoid confusion on the day itself. So, take a moment to find your polling place and get ready to make your vote count—your voice is important!
RING!RING! School’s back in session and getting to class is easy on County Connection! Below, you can find schedules (600 series school routes) for the 2025/26 school year. Note: We’ve adjusted some bus schedule times on routes to align better with bell time changes, which helps to improve on-time performance.
Free & discounted youth transit passes!
PASS2CLASS – Free Bus Passes, Aug-Sept 2025
Pass2Class offers free bus passes to Contra Costa students at the beginning of the school year to ride County Connection until September 30 of the current year. >> Learn more about Pass2Class
YOUTH CLIPPER CARD – Half off Bay Area transit, year-round
Youth can save 50% on County Connection fixed-route service including school routes (600 select series) with a Youth Clipper Card. >> Learn more about Youth Clipper Cards
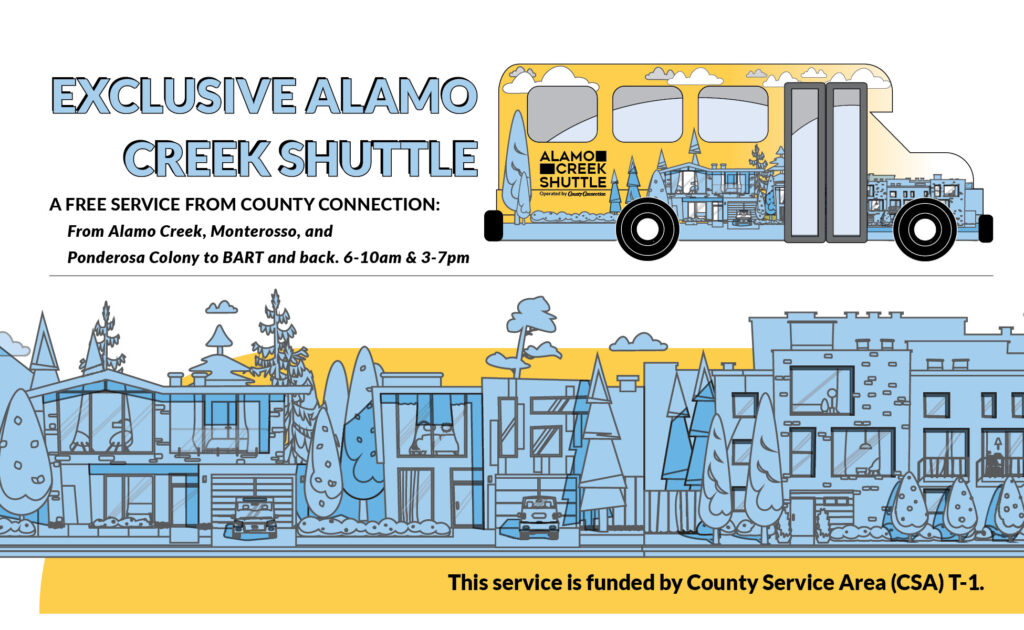
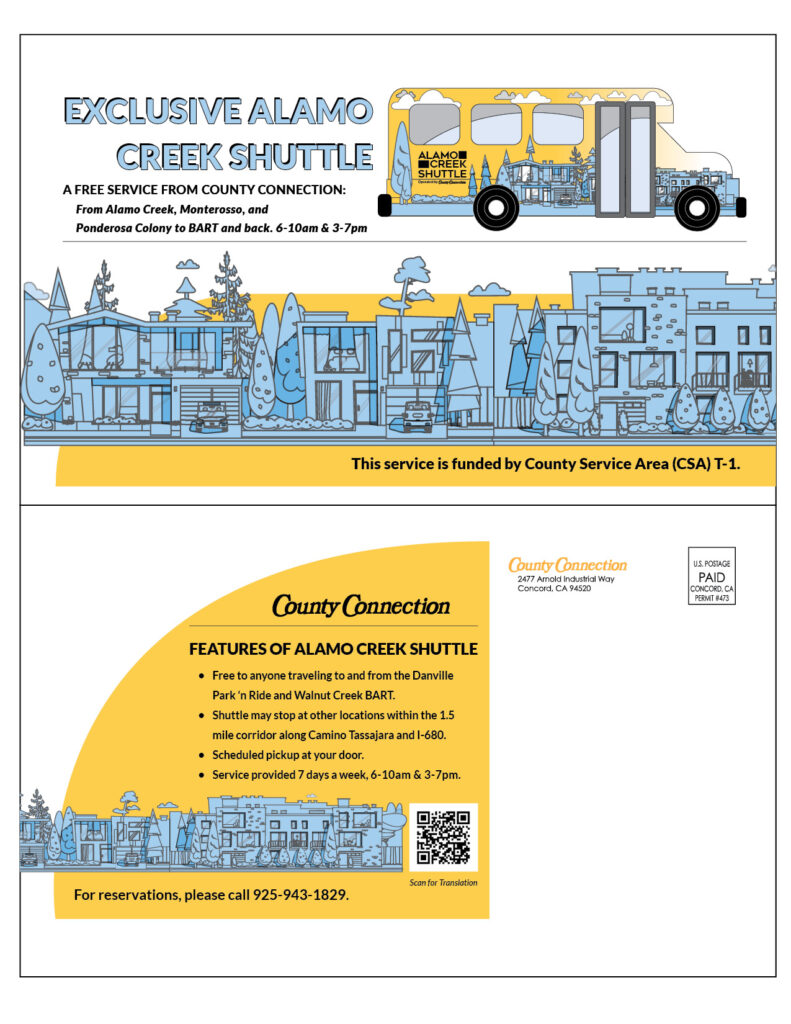
The Alamo Creek Shuttle is a free service from County Connection to anyone traveling to and from the Alamo Creek, Monterosso, and Ponderosa Colony housing developments. The Alamo Creek Shuttle serves the Danville Park ‘n Ride and Walnut Creek BART, and may stop at other locations with the 1.5 mile corridor along Camino Tassajara and I-680. The shuttle will pick up at your door Monday-Friday between 6-10am & 3-7pm. Advanced reservations can be made 7 days a week.